2024-02-15:

We're in the news: Funding dries up for Island's school-based weather network

Histograms of Average Wind Speed

Fernwood Elementary School

See below for more information.

Select a category.

Select a location.

Year Histogram of Average Wind Speed at Fernwood Elementary School

Description

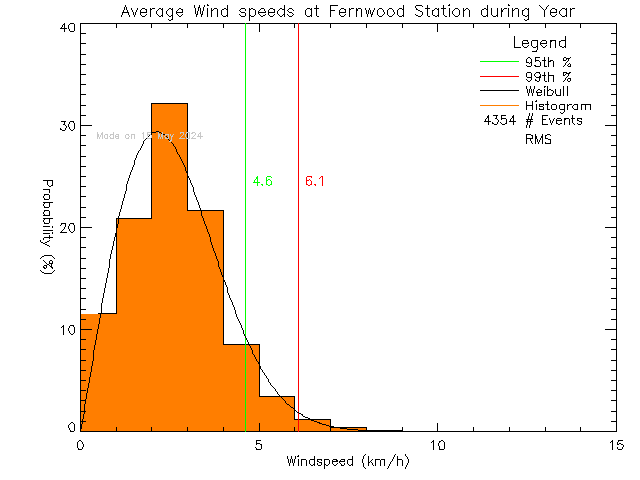
Daily average wind speeds are collected and examined to produce these histograms. A curve fitted to the histogram gives us a probability density function (PDF). We choose the best from the following functions: Gamma, max or min Gumbel, Weibull, Gaussian and Spline. The PDF allows us to estimate the 95th and 99th percentiles of the data.

The plots are shown for the entire year and for each season. The seasons are defined as follows:

  • Winter — DJF: December, January, February
  • Spring — MAM: March, April, May
  • Summer — JJA: June, July, August
  • Autumn — SON: September, October, November

This page took 7.1 ms to generate.

Disclaimer:

The Vancouver Island School-Based Weather Station Network is an education first project. Data from the network are made freely available as is to the public with no guarantee of accuracy or availability. Commercial use requires a license. Please contact Ed Wiebe, ecwiebe at uvic.ca for more information. This work (this site and all contents not otherwise attributed) by School-Based Weather Station Network is licensed under a Creative Commons Attribution-NonCommercial-ShareAlike 4.0 International License.
Creative Commons License

Valid HTML 5
Powered By UVic EOSC
Last Modified: March 28 2023 08:49:07.