Heating Degree Days for 2012 at Fernwood Elementary School
Heating Degree Days: 1679.3
| 2012 | ||||||||||||
|---|---|---|---|---|---|---|---|---|---|---|---|---|
| Day | Jan | Feb | Mar | Apr | May | Jun | Jul | Aug | Sep | Oct | Nov | Dec |
| Totals | 161.4 | 187.4 | 140 | 42.9 | 25 | 90.9 | 251.7 | 346.5 | 433.5 | |||
| Day | Jan | Feb | Mar | Apr | May | Jun | Jul | Aug | Sep | Oct | Nov | Dec |
| Totals | 161.4 | 187.4 | 140 | 42.9 | 25 | 90.9 | 251.7 | 346.5 | 433.5 | |||
| 1 | 8.8 | 3.5 | 2.8 | 1.3 | 3.4 | 4.6 | 7.5 | 10.6 | ||||
| 2 | 9.9 | 5.3 | 5.4 | 0.1 | 3.0 | 5.6 | 7.3 | 11.1 | ||||
| 3 | 10.4 | 7.2 | 4.8 | 0.0 | 2.2 | 6.3 | 7.4 | 11.3 | ||||
| 4 | 8.7 | 7.8 | 4.3 | 0.0 | 1.1 | 5.6 | 6.5 | 10.7 | ||||
| 5 | 8.6 | 5.8 | 2.9 | 0.0 | 1.4 | 5.9 | 8.7 | 13.1 | ||||
| 6 | 8.2 | 6.3 | 0.4 | 0.0 | 0.0 | 5.2 | 9.7 | 13.5 | ||||
| 7 | 5.9 | 7.6 | 0.3 | 0.0 | 0.0 | 4.9 | 10.6 | 14.5 | ||||
| 8 | 3.8 | 7.3 | 0.0 | 0.7 | 0.0 | 5.6 | 11.7 | 15.8 | ||||
| 9 | 9.1 | 5.9 | 0.0 | 0.2 | 2.1 | 8.0 | 14.3 | 15.3 | ||||
| 10 | 9.6 | 5.0 | 0.9 | 0.0 | 5.0 | 8.4 | 16.4 | 14.2 | ||||
| 11 | 8.6 | 3.4 | 0.0 | 0.0 | 5.8 | 8.3 | 14.6 | 12.4 | ||||
| 12 | 9.1 | 5.2 | 3.5 | 0.0 | 0.0 | 4.0 | 7.9 | 11.4 | 13.6 | |||
| 13 | 9.9 | 2.3 | 5.3 | 0.0 | 0.0 | 2.4 | 5.8 | 10.7 | 13.8 | |||
| 14 | 9.2 | 0.4 | 6.1 | 0.0 | 0.0 | 2.0 | 5.2 | 11.7 | 15.4 | |||
| 15 | 8.2 | 3.5 | 5.0 | 2.1 | 0.0 | 2.7 | 7.7 | 12.8 | 14.5 | |||
| 16 | 9.1 | 5.1 | 3.8 | 0.0 | 0.0 | 1.3 | 6.8 | 12.1 | 14.8 | |||
| 17 | 11.3 | 6.2 | 2.8 | 0.0 | 0.0 | 0.2 | 9.8 | 10.5 | 15.2 | |||
| 18 | 9.1 | 8.1 | 5.3 | 2.5 | 0.0 | 1.1 | 9.0 | 11.3 | 16.2 | |||
| 19 | 10.3 | 6.2 | 4.3 | 0.0 | 1.0 | 2.2 | 6.7 | 10.6 | 14.8 | |||
| 20 | 8.6 | 5.6 | 3.5 | 1.1 | 0.1 | 1.9 | 11.4 | 11.0 | 14.4 | |||
| 21 | 9.3 | 5.6 | 1.4 | 0.8 | 0.8 | 5.6 | 11.9 | 13.8 | 14.6 | |||
| 22 | 5.7 | 7.0 | 5.4 | 1.8 | 1.5 | 4.2 | 12.3 | 12.7 | 14.2 | |||
| 23 | 5.5 | 6.5 | 5.6 | 2.5 | 2.5 | 4.6 | 12.0 | 11.1 | 13.1 | |||
| 24 | 7.1 | 6.1 | 5.7 | 1.9 | 2.7 | 4.5 | 12.1 | 13.6 | 14.3 | |||
| 25 | 7.4 | 1.0 | 3.6 | 0.0 | 1.9 | 4.8 | 11.3 | 15.0 | 14.8 | |||
| 26 | 7.4 | 0.0 | 2.5 | 0.0 | 2.3 | 5.5 | 11.2 | 15.6 | 14.1 | |||
| 27 | 9.3 | 3.0 | 3.3 | 2.3 | 1.9 | 4.3 | 10.2 | 15.5 | 14.2 | |||
| 28 | 8.9 | 4.3 | 3.8 | 2.0 | 1.4 | 4.2 | 8.6 | 14.0 | 13.6 | |||
| 29 | 7.5 | 6.6 | 1.5 | 1.2 | 1.3 | 5.1 | 7.7 | 9.1 | 13.9 | |||
| 30 | 8.5 | 7.2 | 2.5 | 1.9 | 2.5 | 6.3 | 7.8 | 9.3 | 15.5 | |||
| 31 | 5.9 | 1.0 | 2.8 | 7.9 | 16.0 | |||||||
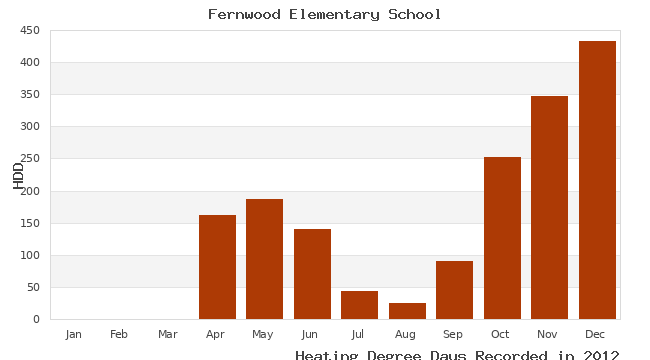
This table shows the daily and monthly heating degree days (HDD). Heating degree days are a measure of how much heating is required to maintain a standard temperature in a building.
The rows indicate day of the month with the months shown in the columns. Blank entries indicate that there is missing data or that there is no such date. Values marked with a different colour are calculated using incomplete data. When there are too many missing observations in a day the HDD is computed from the average of the daily extremes. Depending on what data is missing during the day the HDD value computed in this way may be a poor estimate of the real value.
The number of heating degree days is computed by subtracting the daily average temperature from a reference temperature if it is less than the average temperature or is simply equal to 0 HDD if the average temperature is greater than the reference temperature. We use 18 °C as the reference temperature.
For example, a day with an average temperature of 10 °C has 8 heating degree days (HDD), a day with an average of 16.4 °C has 1.6 HDD, a day with an average temperature of 18 °C has 0 HDD. Finally, a day with an average temperature of 21°C has 0 HDD.
The totals shown on this page include all data that we have collected for each station. Annual and monthly totals will be incomplete for stations that came online part way through the year or where data collection didn't occur for some reason.

